


LRP: The Winning Turnover Recipe for NFL Teams


Jeff Hanisch-USA TODAY Sports
Each year at this time, I author this article which shows the correlation between a team’s TO margin and their record. No one likes to read it because it points out to the handicapper that regardless of how much hard work you put into analyzing NFL games, there is no statistic that leads to ATS success and failure more than a team’s TO margin in a particular game. Consider that, once again this year, any NFL team who has a +3 or more net TO margin against their opponent in a given game is 32-3 (91%) ATS. Combining it with records for the previous 5 years, we find that the long-term record is now 209-19 (92%) ATS for any NFL team with a +3 or more net TO margin in a game. In addition, teams with a +2 net TO margin in a given game approaches 80% ATS success, while even a +1 net TO margin results in over 65% ATS success.
The bottom line is that regardless of a handicapper’s expertise in analyzing an NFL game from a fundamental, statistical, situational or technical perspective, the results are still most closely hinged on net TO margin. The chart below shows us the degree to which this is true for NFL teams based on their YTD net TO margin. The teams are listed from the team with the greatest positive net TO margin to the team with the greatest negative net TO margin. The results, as isolated below, are painfully clear. To continue reading, head to Locker Room Picks.


25 Athletes On Santa's Naughty List In 2014
Santa will be delivering a lump of coal to these 25 naughty athletes. Read More
Hot Athletes You'd Love to Meet Under Mistletoe
With Christmas just around the corner, we've decided to take a look at some female athletes you'd love to meet under the mistletoe. Read More
10 Athletes Who Can Afford To Buy a Sports Team
These athletes can buy pretty much buy anything they want and should consider purchasing a sports team. Read More
Manziel 10 Pro Athletes Who Failed In Their Debuts
Johnny Manziel isn't the first player to have a horrible debut. In fact, several future stars looked like chumps in their debuts. These 10 were as bad or worse than Manziel. Read More
Preteesh Balyaya Gives Insight to EFLI
In an exclusive interview, Rant Sports chatted with Preteesh Balyaya of Mumbai Gladiators to get some insight on the EFLI. Read More
Documenting the EFLI
Here's an inside look at the EFLI, a groundbreaking american football league in India. Read More

Importance of International Competitions
With the ICC World Cup and junior FIFA World Cup coming up, sports fans in India are getting excited about international sports tournaments. Read More

List of ICC World Cup Winners
Five different teams have won the ICC Cricket World Cup since the tournament began in 1975. Here is the full list of winners and 2nd place finishers. Read More
India's Olympic Medals
India has a rich sports history. Here is a list of the nation's Olympic medals. Read More

Hockey India Cuts Ties with Pakistan
Following Pakistani players' obscene gestures after their win over India, Hockey India has cut all ties with Pakistan. Read More

IPTL Draft Results
With Nadal on the Indian-based team, Mumbai is more than excited for the IPTL tournament. Read More
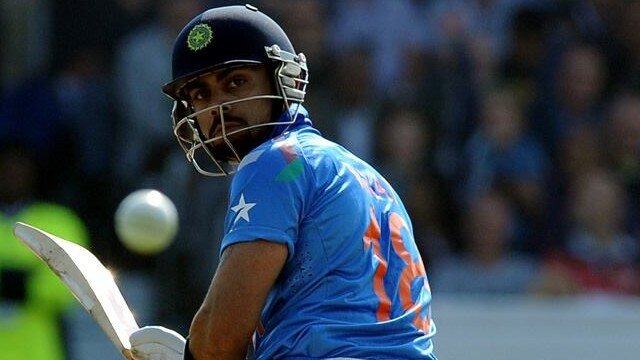
Virat Kohli Stays Positive
Despite coming up short against Australia in the first Test, Virat Kohli stays positive about the team. Read More