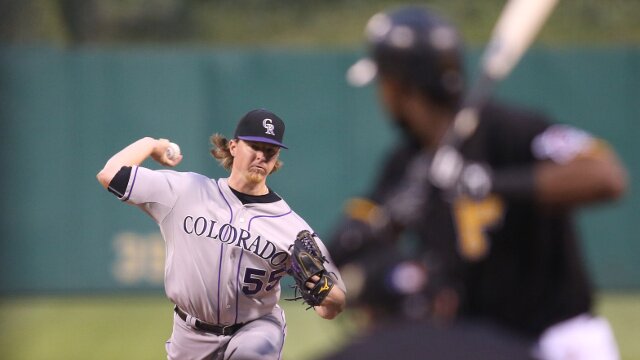


Charles LeClaire-USA TODAY Sports
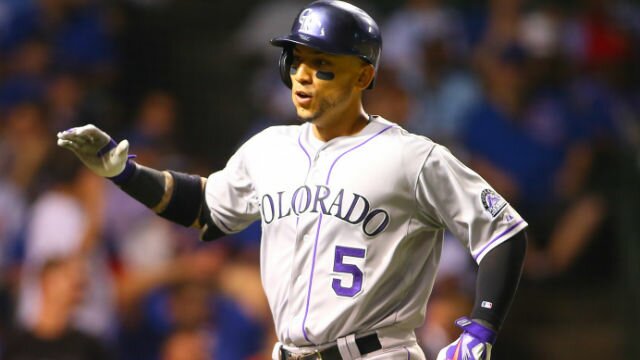
On Monday, it was reported that the Colorado Rockies had agreed to a minor league deal with reliever John Axford. Although he will reportedly earn a base salary of $2.6 million if he makes the team, some may still see the fact that he settled for a non-guaranteed contract as a sign of just how far he has fallen over the course of merely a few short years.
Back in 2011, Axford was an elite closer for the Milwaukee Brewers, leading the team to its very first NL Central title. During that campaign, Axford was 2-2 with a 1.95 ERA, 2.41 FIP, 2.85 xFIP and a 1.14 WHIP while saving 46 games. He was also worth 1.8 fWAR, matching a career-high that he set the previous year.
In the three seasons since 2011, however, Axford has become a middling-to-below-replacement level pitcher, bouncing around between the Brewers, St. Louis Cardinals, Cleveland Indians and Pittsburgh Pirates.
While some may feel that Axford did nothing but continue his downhill slide in 2014, posting a career-worst -0.5 fWAR with the Indians and Pirates, there were actually many positive signs that could very well indicate that the soon-to-be 32-year-old is not too far gone.
For starters, even though he posted a 4.34 FIP, his ERA, xFIP and SIERA were each below the 4.00 marker, settling in at 3.95, 3.93 and 3.73 respectively. Furthermore, according to Fangraphs, Axford’s fastball was coming in at an average velocity of 94.4 mph, which should certainly be seen as an encouraging sign as well.
He even showed last season that he could still run the heater up to as high as 98 mph when he wanted to. It’s not quite the triple-digits he was able to hit back in 2012, but plenty of heat to get major leaguers out with. And really, if you look at his raw ability to generate outs, that skill is alive and well. His 36th-ranked 10.37 K/9 (among 142 qualifying relievers) in 2014 proved that he can still ring up batters, so velocity and Ks are certainly not the problem.
Perhaps the most interesting number from Axford’s 2014 campaign was his 53.6 percent ground-ball rate, besting his 2011 mark of 49.7 to set a new career-high. Seeing as how he is moving to the homer-friendly Coors Field, it will become increasingly important for Axford to continue inducing ground balls, especially when considering the fact that he has also been stung fairly hard by the home run ball over the past three years.
While Axford’s HR/FB was quite high at 13.3 percent last season, it is worth noting that it was actually a three-year low, but it may become more important than ever for him to keep the ball on the ground in Colorado. Otherwise, it would hardly be surprising to see his HR/FB sail all the way back up to the 19.2 percent mark he posted in 2012.
Surprisingly enough, Axford’s line drive rate was actually a career-low at 13.8 percent last season, which some might also find noteworthy, even if the sample size is small. According to Brooks Baseball, Axford began throwing a cutter more frequently, a pitch that produced very few line drives per BIP throughout the season, which can be seen in the chart below.
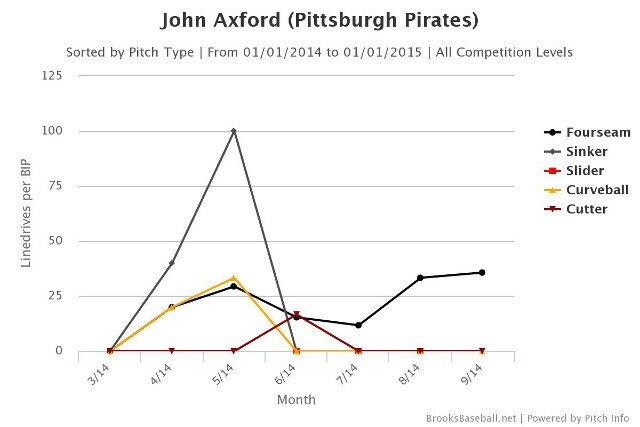
Chart Courtesy of Brooks Baseball
Although there is usually a certain amount of luck involved, Axford posted a .272 BABIP in 2014, which was his best mark in that department since his rookie season back in 2009. If Axford can continue having favorable luck on balls in play, that will obviously bode well for him going forward.
The Rockies were not necessarily the strongest defensive team in 2014, posting a -1.9 UZR/150 and a -11.5 Def rating, but they could have a very good infield in 2015 if everyone can stay healthy. With Justin Morneau and Nolan Arenado on the corners and Troy Tulowitzki and D.J. LeMahieu making up the double-play combination, that team should certainly be able to gobble up Axford’s grounders.
So if the 2014 version of Axford could get guys out via the K, generated fewer line drives and more grounders than ever, plus cut his HR/FB rate by a significant margin to a three-year low … well, what’s the problem?
As it turns out, none of that matters when he can’t put the ball relatively close to where he wants. Last season, he posted a 5.93 BB/9, marking the second time in the past three seasons he had eclipsed the 5.00 mark in that department. While he has never had exceptional command, he posted a career-best 3.05 BB/9 while he was going strong in 2011. To put it simply, he still needs to work on finding the strike zone.
Aside from losing command, it can be difficult to pinpoint exactly what else has gone wrong with Axford over the past three seasons. One factor that is impossible to ignore, however, is that one of the things that made Axford so effective back in 2011 was his ability to get left-handed hitters out.
During that campaign, the righty held lefties to a .189/.246/.234 triple-slash with a .222 wOBA. However, lefties made a modest improvement to a .221/.337/.333 batting line and a .302 wOBA in 2012, and then hit .290/.382/.456 with a .367 wOBA against him in 2013. After Axford was traded to St. Louis in August of 2013, it was reported that the Cardinals’ coaching staff informed him that he had been tipping pitches, which might also help to explain some of his struggles.
It would be worthwhile to take a look at his pitch location too.
The following heat map shows that when Axford was cruising along in 2011, he liked to work above the strike zone against lefties, throwing many pitches high and away.
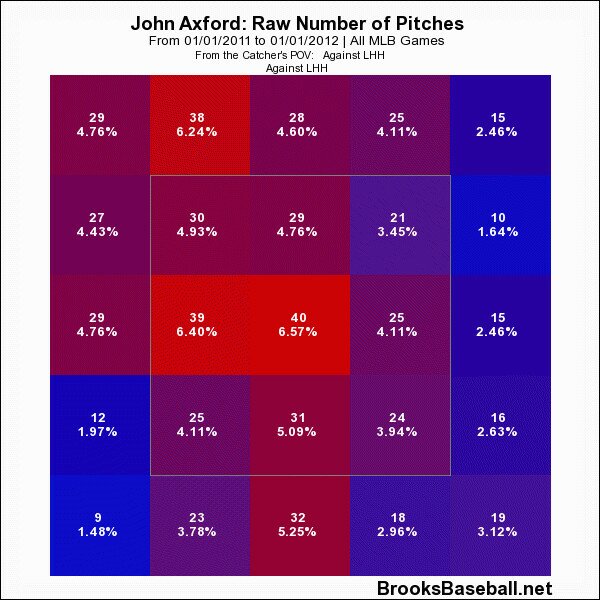
Chart Courtesy of Brooks Baseball
The following heat map shows that from 2012-13, although Axford was still throwing elevated pitches, he was also working down in the zone and inside more frequently.
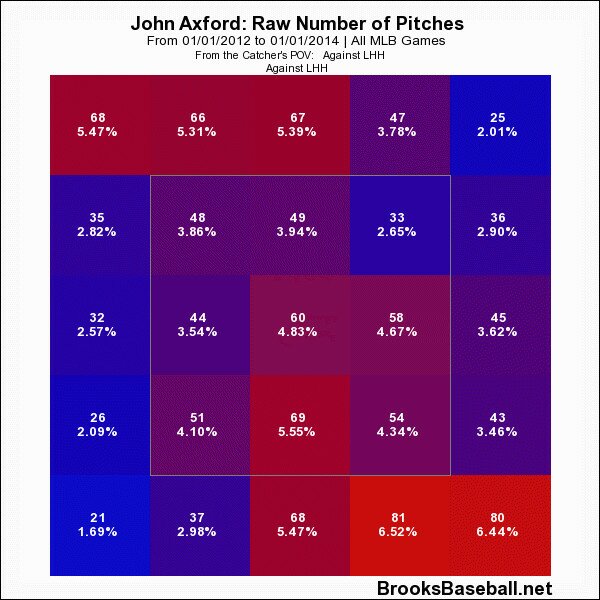
Chart Courtesy of Brooks Baseball
In 2014, Axford was able to regain some of his past success against left-handers, limiting them to a .183/.333/.297 triple-slash with a .285 wOBA. Of course, the .333 OBP was still a tad high, but the batting average, slugging percentage and wOBA each falling significantly should certainly be seen as positives. This is a trend that will certainly need to continue in 2015.
So, what did he do differently? Well, once again, perhaps we can begin by examining his pitch selection against left-handed hitters. As seen in the next heat map, there was an uptick in the percentage of high and outside pitches compared to 2012-13. Given his command issues, however, it is reasonable to wonder how much of that may or may not have been intentional.
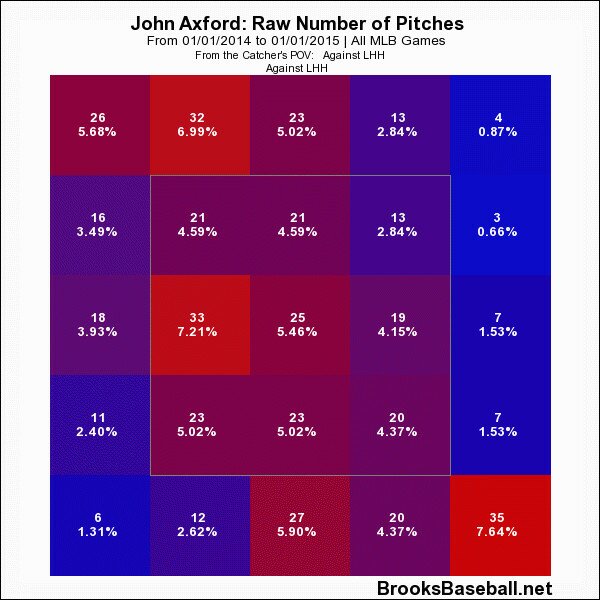
Chart Courtesy of Brooks Baseball
Since the beginning of 2011, the numbers indicate that lefties, for the most part, have had a hard time hitting Axford when he works up in the zone, which can be seen in the final heat map below. Obviously, pitching up in the zone may seem a bit counter-intuitive considering the fact that he will want to limit the number of fly balls he surrenders at Coors Field, but the evidence suggests that he does some of his best work against lefties when he keeps the ball elevated.
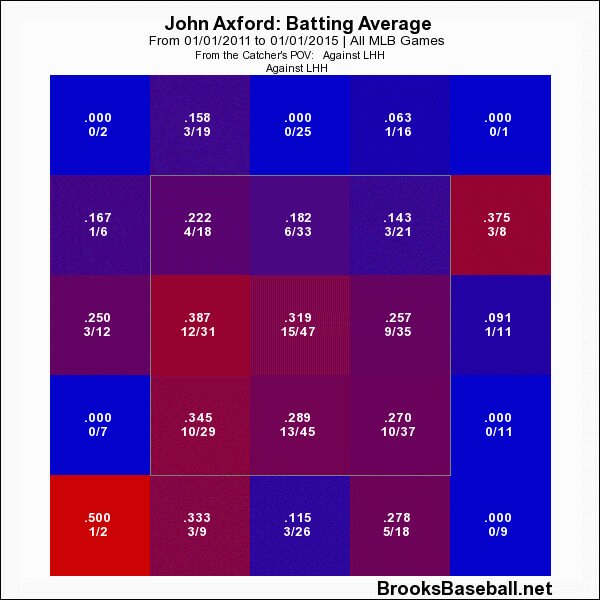
Chart Courtesy of Brooks Baseball
It is also worth taking a look at the types of pitches Axford has been throwing. According to Brooks Baseball, Axford threw two main pitches against lefties in 2011, with his four-seamer and curveball making up 75.49 and 22.56 percent of his pitches against lefties respectively. Lefties hit just .206 against the fastball, while managing a mere .129 BA against the curveball.
Although Axford continued to have decent success with the two pitches against lefties in 2012, they batted a much healthier .259 against the curveball in 2013 and pounced all over the fastball for a .321 BA. Again, this may have had something to do with him tipping his pitches.
Last season, although the sample size was small, Brooks Baseball says that he began mixing in a few more cutters and sinkers against left-handed hitters, both of which yielded positive results. He was able to use the four-seamer and the curveball effectively once again as well, limiting lefties to a .194 and .211 BA against the pitches respectively.
Righties, on the other hand, crushed the curve to the tune of a .417 BA and also hit a respectable .258 against the fastball. While they hit just .125 against the cutter, they batted a cool .500 against a small sampling of sinkers. Overall, right-handed hitters slashed .232/.341/.402 with a .332 wOBA against Axford, so his reverse platoon split is certainly an oddity.
Back in 2011, the heat map below shows that although he liked to work righties down and away, he still moved the ball around quite a bit.
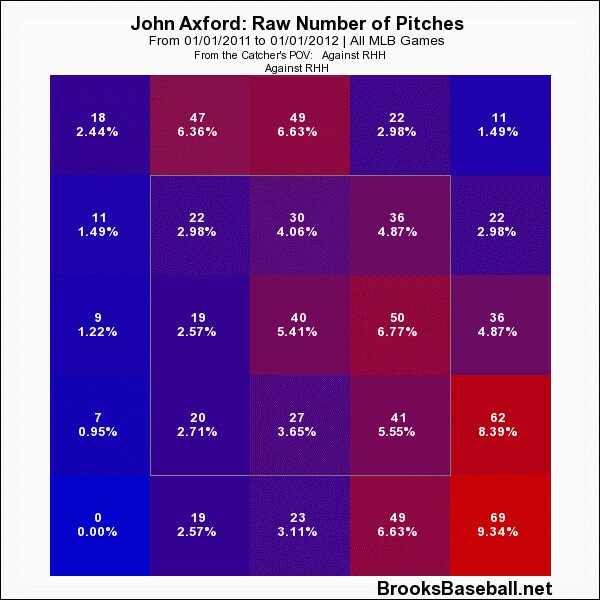
Chart Courtesy of Brooks Baseball
By 2014, however, Axford was missing down and away much more often, which was likely due to his diminished control. According to Fangraphs PITCHf/x Plate Discipline Data, he had a career-low O-swing of 21.7 percent, so obviously hitters didn’t have any trouble laying off pitches that weren’t close.
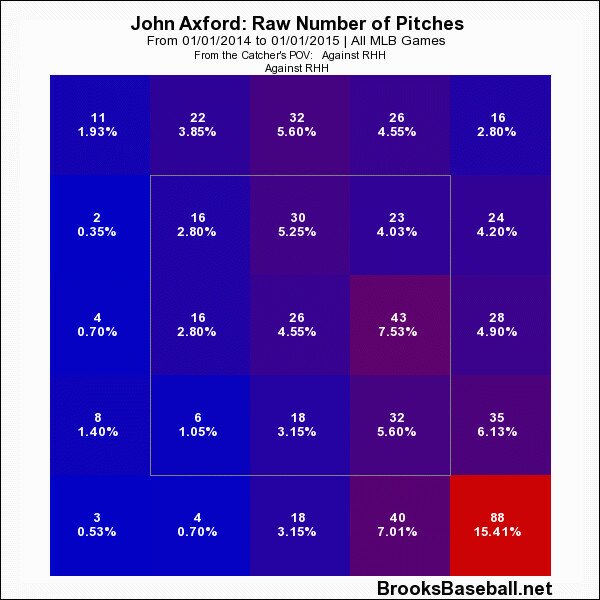
Chart Courtesy of Brooks Baseball
While Axord may still need to work on a few of his numbers against right-handed hitters, sustaining his rediscovered dominance against left-handed hitters is a crucial part of the formula that will be needed in order for him to return to his 2011 form. If he can continue inducing ground balls at a rate of over 50 percent, improve his command and continue to groove in the 95 mph fastball, the potential for him to be a comeback player of the year candidate should certainly still be there.
*All statistical information courtesy of Baseball Reference, Brooks Baseball and Fangraphs
Brad Faber is a Senior Writer and Sabermetrics Columnist for www.RantSports.com. Follow him on Twitter @Brad_Faber, “Like” him on Facebook or add him to your network on LinkedIn or Google.